Logs Explorer in SigNoz
Introduction
The Logs Explorer page in SigNoz enables developers to filter, examine, and analyze logs. There are two ways to filter the logs and each way has 3 different views available in Logs Explorer which include:
Operations on Data
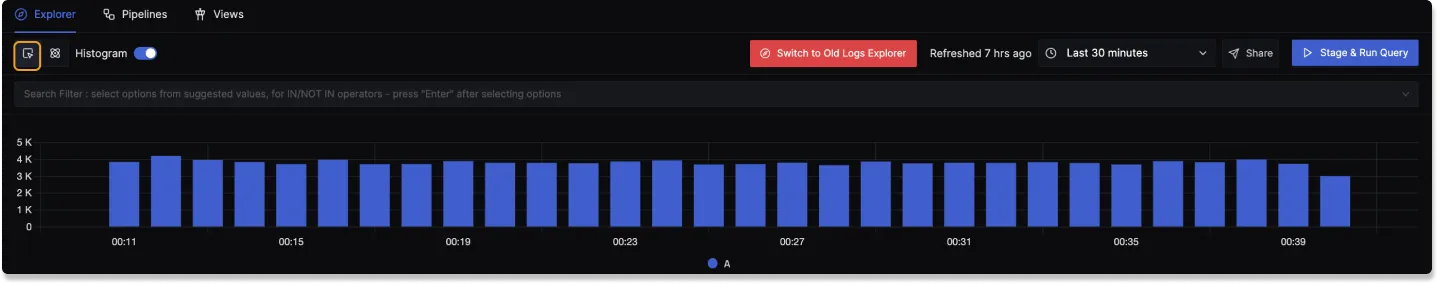
Search
The search feature in Logs Explorer allows you to filter your logs data using different attributes (like serviceName, status etc.) using operators (like IN, = etc.). You can filter using multiple attributes simultaneously.
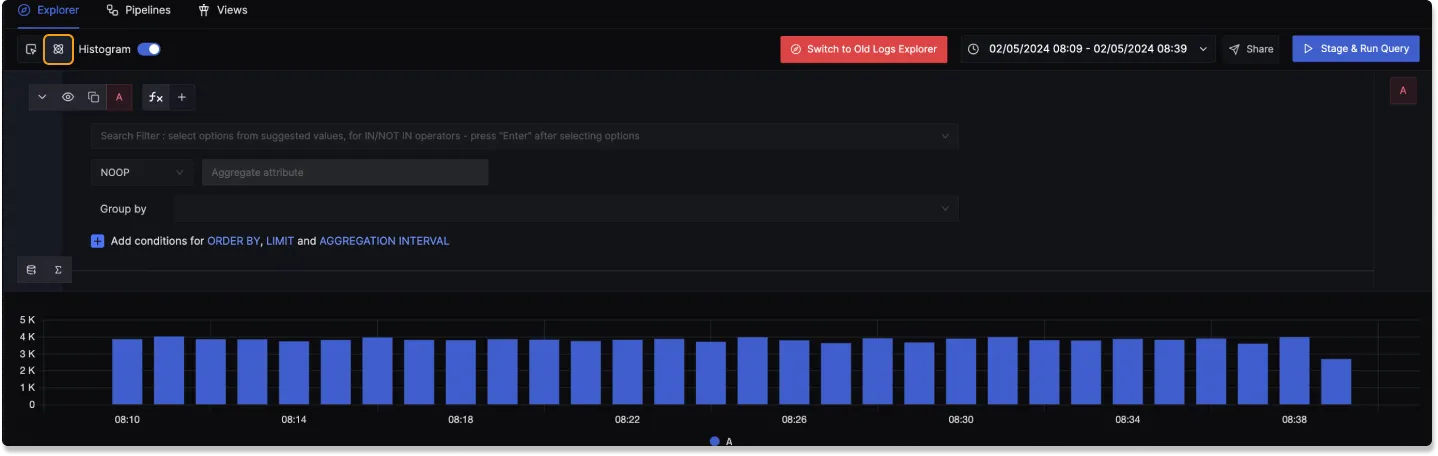
Query Builder
Just like search, the Query Builder also allows you to filter your logs data based on different attributes using operators. The Query Builder provides you with additional powerful features like aggregation, grouping etc. on your data. To learn more about the Query Builder, refer to this documentation.
Views
There are three views available in both Search and Query Builder.
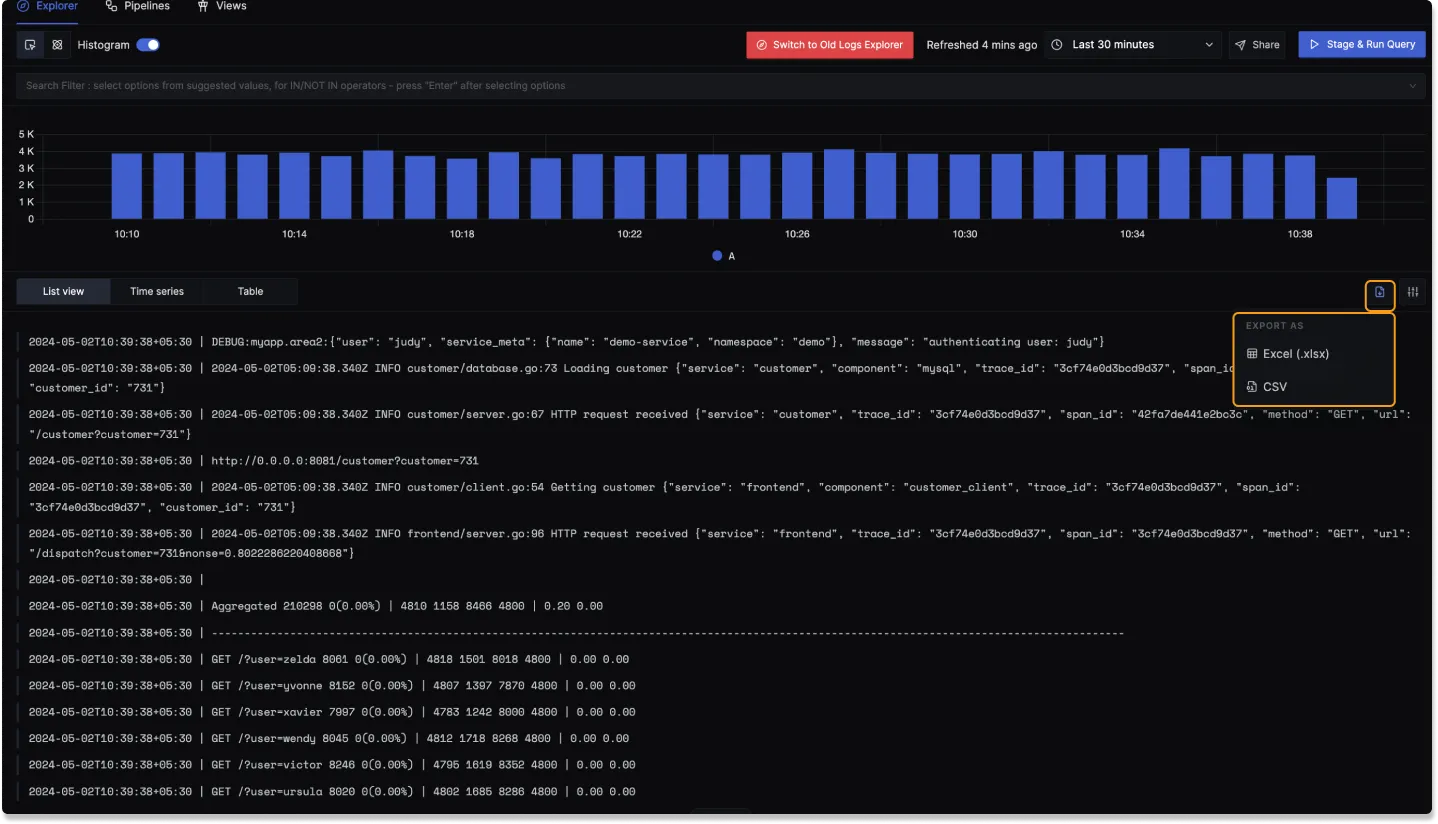
List View
The list view in logs explorer has the following features:
Download logs
You can download your logs in two format:
- Excel (.xlsx)
- CSV
Settings
The settings option has three sections:
Format
There are three formats available which represents the logs in different formats :
- Raw: Shows the logs entries in the raw format as they appear in the logging system.
- Default: It provides a balanced view by formatting a raw log based on different attributes to make it more readable.
- Column: It organizes the logs data into different attribute Columns to provide a tabular view of logs.
Max lines per row
The maximum number of lines of text that each log entry is allowed to display.
Columns
You can add new columns for the different attributes available in your logs. This only works for Default and Column format. By default the log is formatted into Timestamp and Body in the Default and Column views.
Show in Context
When you hover over a log in any format, at the right most side, you'll find an option to Show in Context.
This will by default show you 10 logs before and 10 logs after the log that you have selected which can be used in faster debugging.
You can load more than 10 logs logs and also filter the logs by a particular attribute.
Copy Link
You can copy the link to a particular log line which can be shared and accessed by anyone who has access to same SigNoz instance.
Time Series View
The Time Series View provides a graphical representation of logs data over time based on the filters or operations applied.
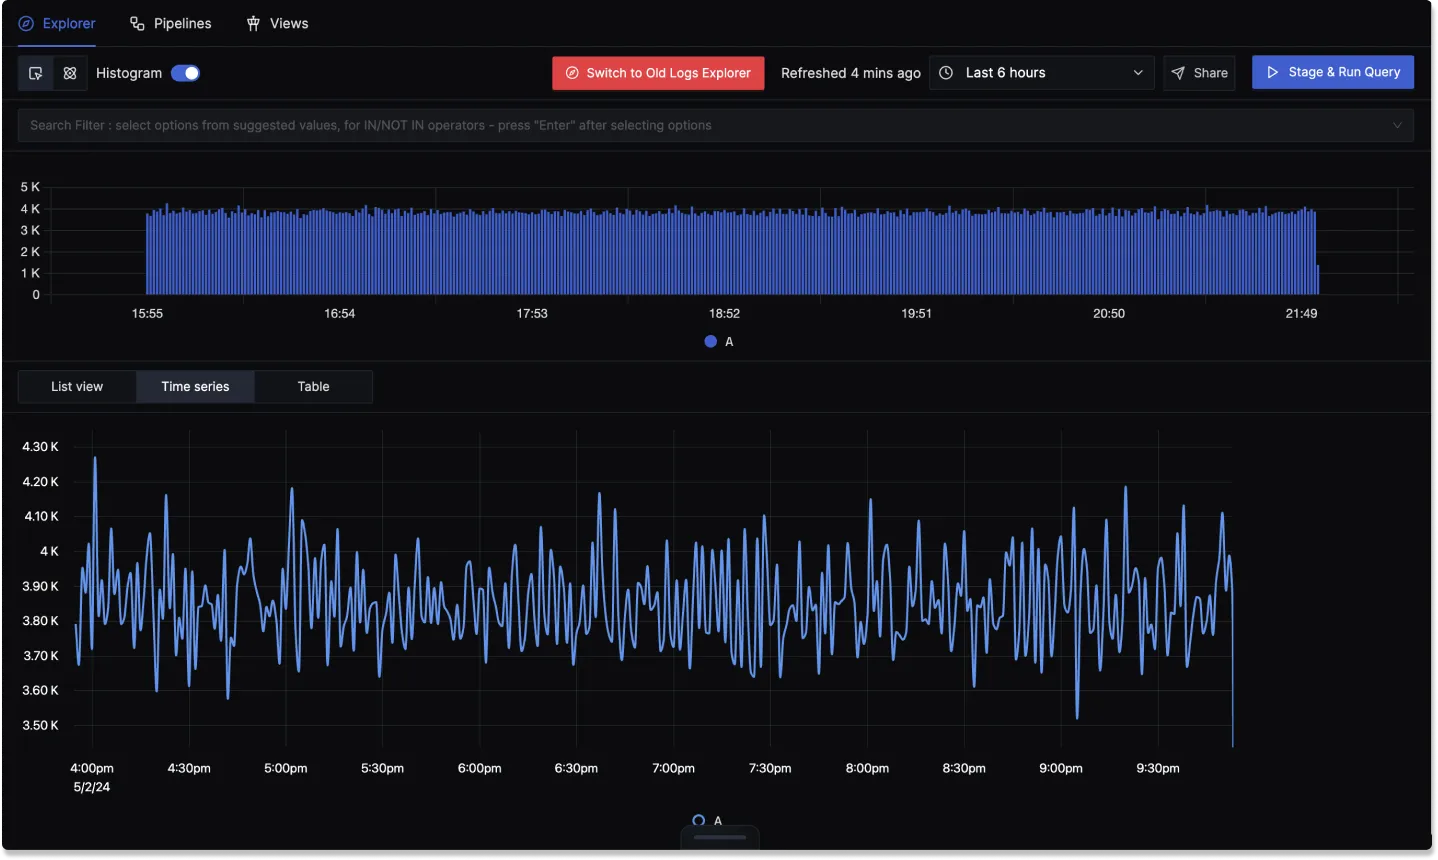
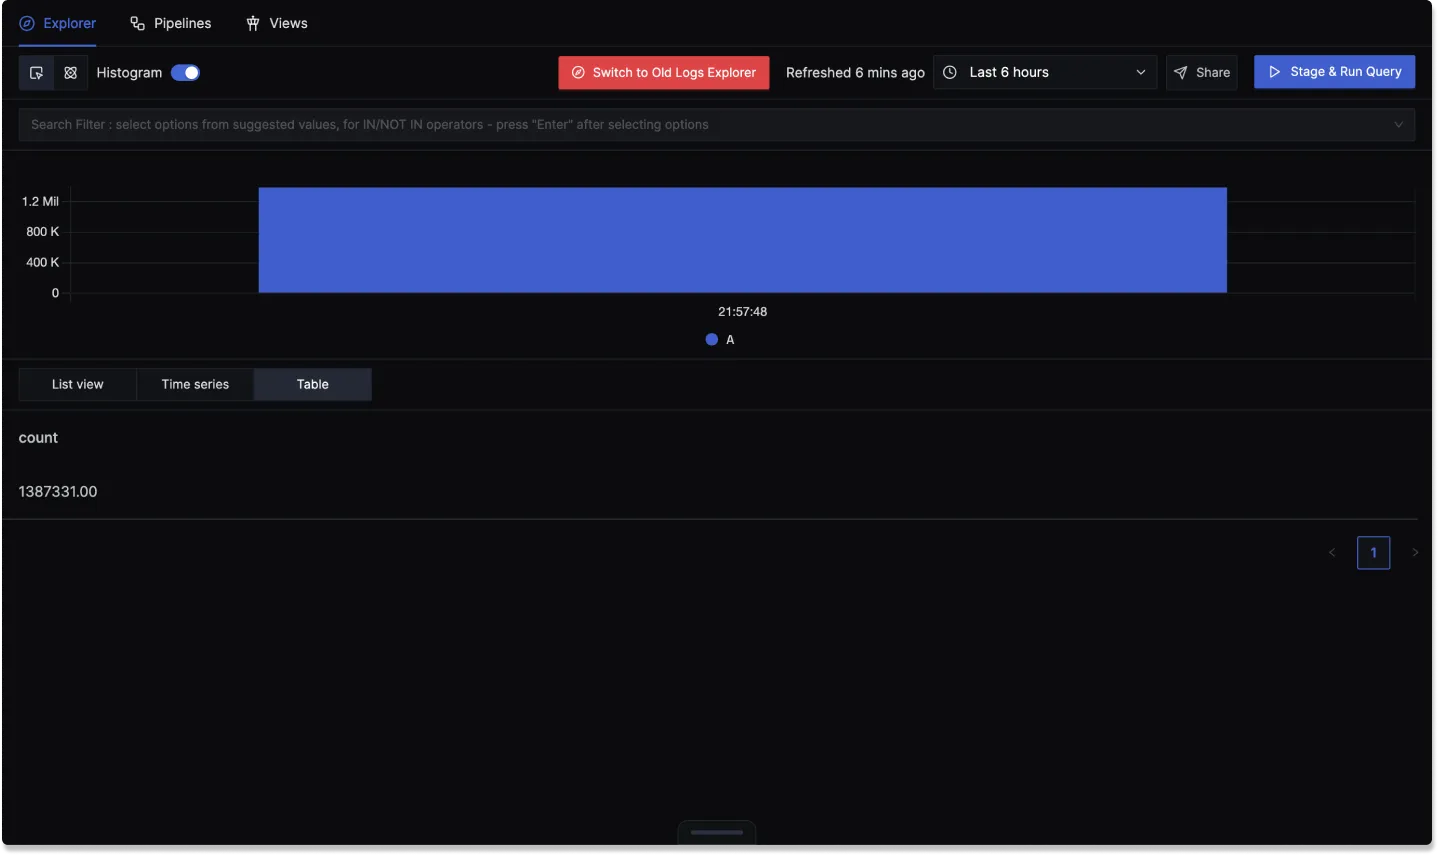
Table View
The Table View provides a tabular representation of different operations like the count logs, average of duration etc., based on the filters applied.
Log Details
When you click on a log line in any format it will open up a Log Detail panel which gives a comprehensive view of your log. This is only available in the List View.
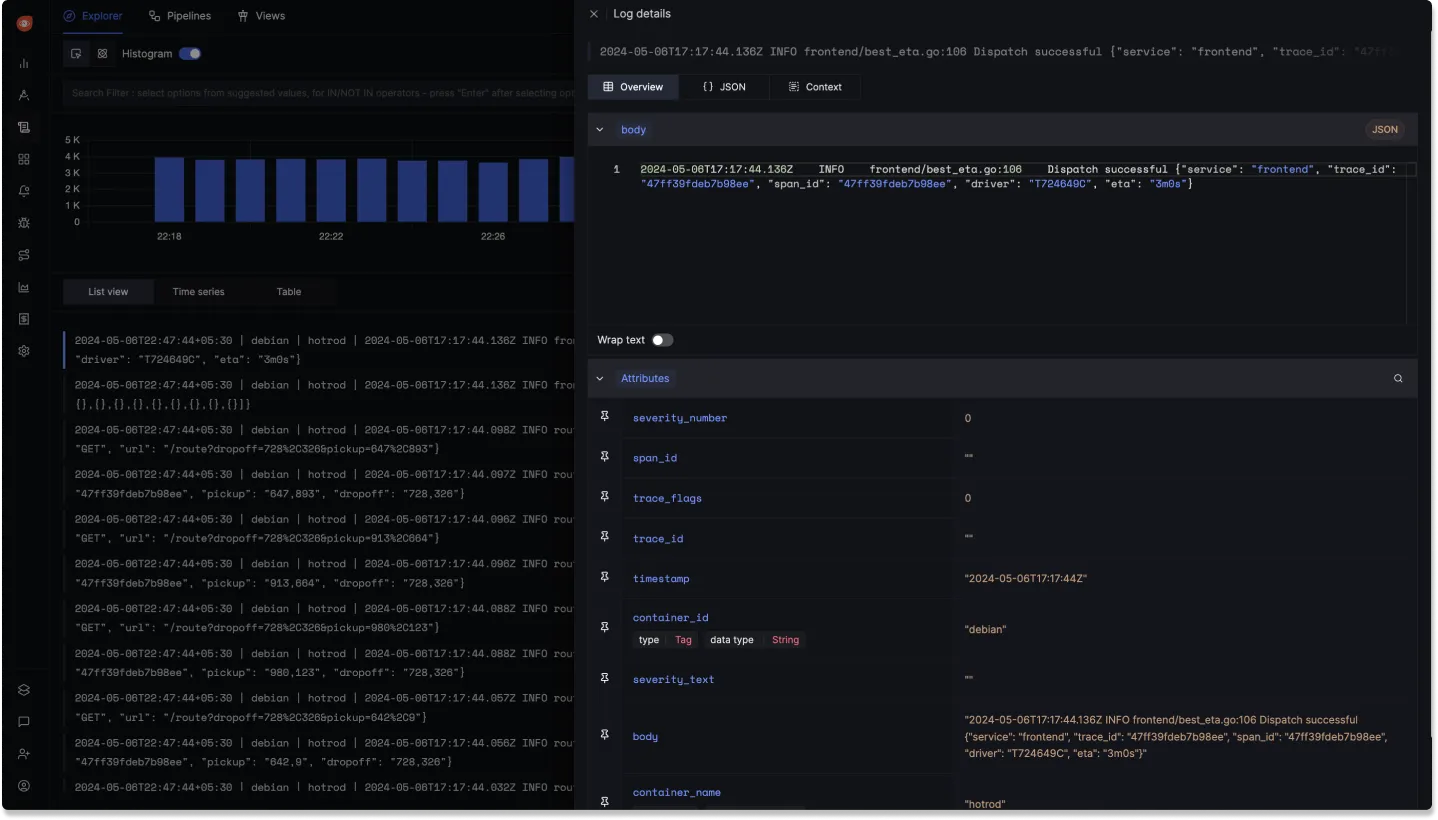
The panel provides the following sections:
Overview
Overview has two sections:
Body
This shows the complete body of the log in JSON format by default. Once you toggle on Wrap text, the logs get converted to the Raw format.
Attributes
This the attributes of the logs in a tabular format showing the attribute name and its value.
The following features are available in this section:
Pin an attribute
You can pin an attribute using the pin icon shown on the left side of the attribute name. The pinned attribute will be shown at the top when you open a new log line.
Search Attribute
You can search for an attribute available in your log using the search bar.
Filter for Value
Using this, you can instantly filter the logs based on a particular attribute and its value using the IN operator.
For example, if the attribute is container_id and it's value is debian then using Filter for Value will create a filter container_id IN debian. This will list the logs where the container_id attribute is debian.
Filter out Value
Using this, you can instantly filter the logs based on a particular attribute and its value using the NOT_IN operator.
For example, if the attribute is container_id and it's value is debian then using Filter out Value will create a filter container_id NOT_IN debian. This will list the logs where the container_id attribute is not debian.
JSON
This section displays the log in JSON format. You can:
Wrap Text
Switching the toggle on for wrap text will convert your log to raw format from JSON.
Copy Log
Copy your log in either JSON or Raw form.

Context
This section will by default show you 10 logs before and 10 logs after the log that you have selected which can be used in faster debugging.
You can:
- Load more than 10 logs.
- Filter the logs by a particular attribute.
Live View
The Live View streams new log entries continuously as they occur. This can help in debugging the real-time incidents.
These are the following features available in live view:
Search Filter
You can filter your logs based on different attributes. Just below the search filter section, you get a histogram which shows the count of logs at different times for the particular filter(s).
Format
Just like List View, there are three formats in which you can view your logs:
- Raw
- Table
- List (Default)
By hovering over the Format button in the Raw and Table View, you can change the Max lines per Row for your logs.
Pause and Resume
The Live Logs can be paused to stop the real-time feed. This allows users to scroll through the logs without new entries being pushed.