Parse Trace Information for your Logs
Overview
If your logs contain trace information outside the standard OpenTelemetry fields, you can use log pipelines to parse that information into the right fields and enable correlation of your logs to and from corresponding traces.
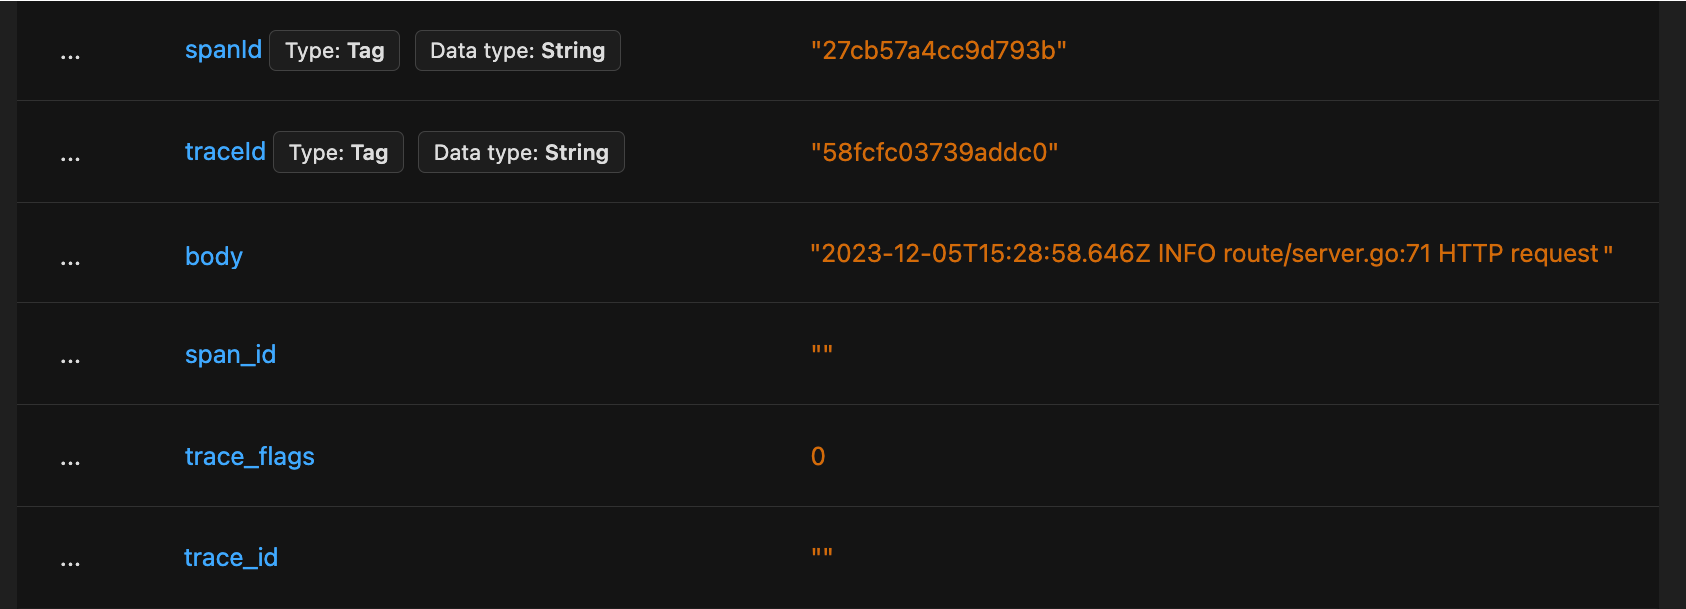
A log with trace information in log attributes named traceId and spanId, while span_id and trace_id fields are empty
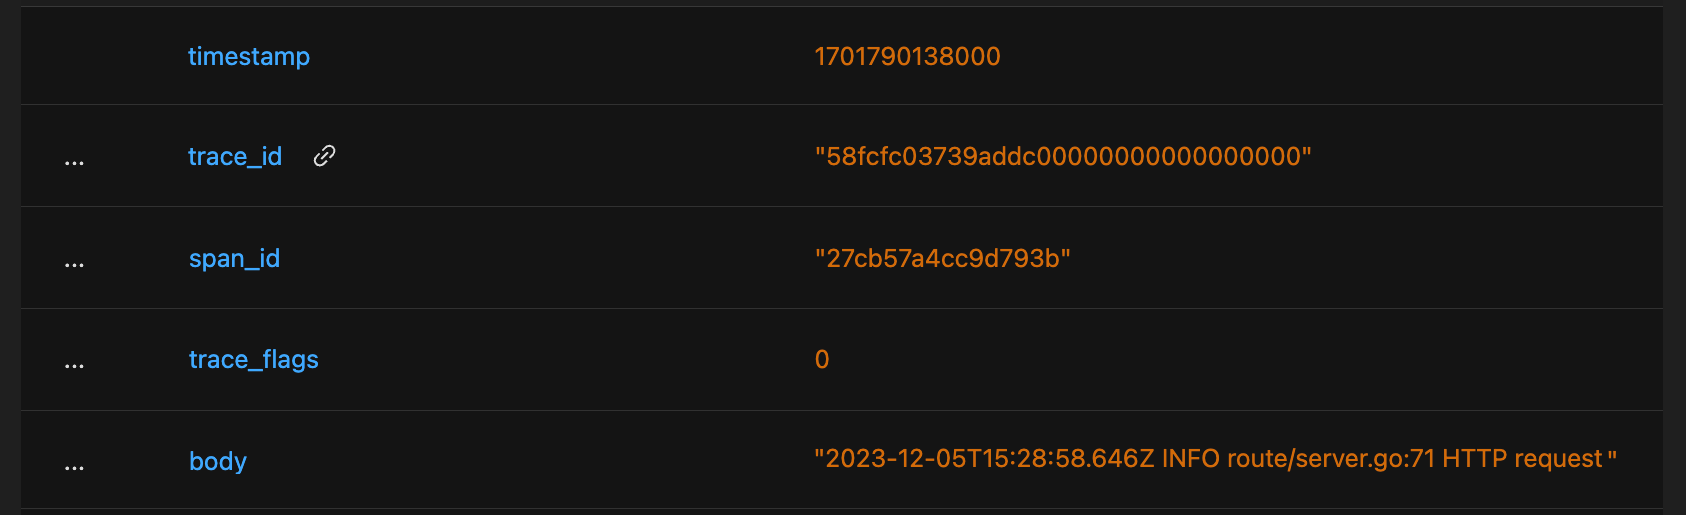
A log with span_id and trace_id fields populated based on log attributes, with trace_id linking to corresponding trace
In this guide, you will see how to parse values from log attributes into the trace_id, span_id and trace_flags fields.
Prerequisites
- You are sending logs to SigNoz.
- Your logs contain trace information in log attributes.
If your logs contain trace information in the body, you can parse them out into their own attributes before populating trace information based on them.
Create a Pipeline to Parse Trace Information out of Log Attributes
You can follow the steps below to create a log pipeline for populating trace information based on data in log attributes.
Step 1: Navigate to Logs Pipelines Page
Hover over the Logs menu in the sidebar and click on the Logs Pipeline submenu item.
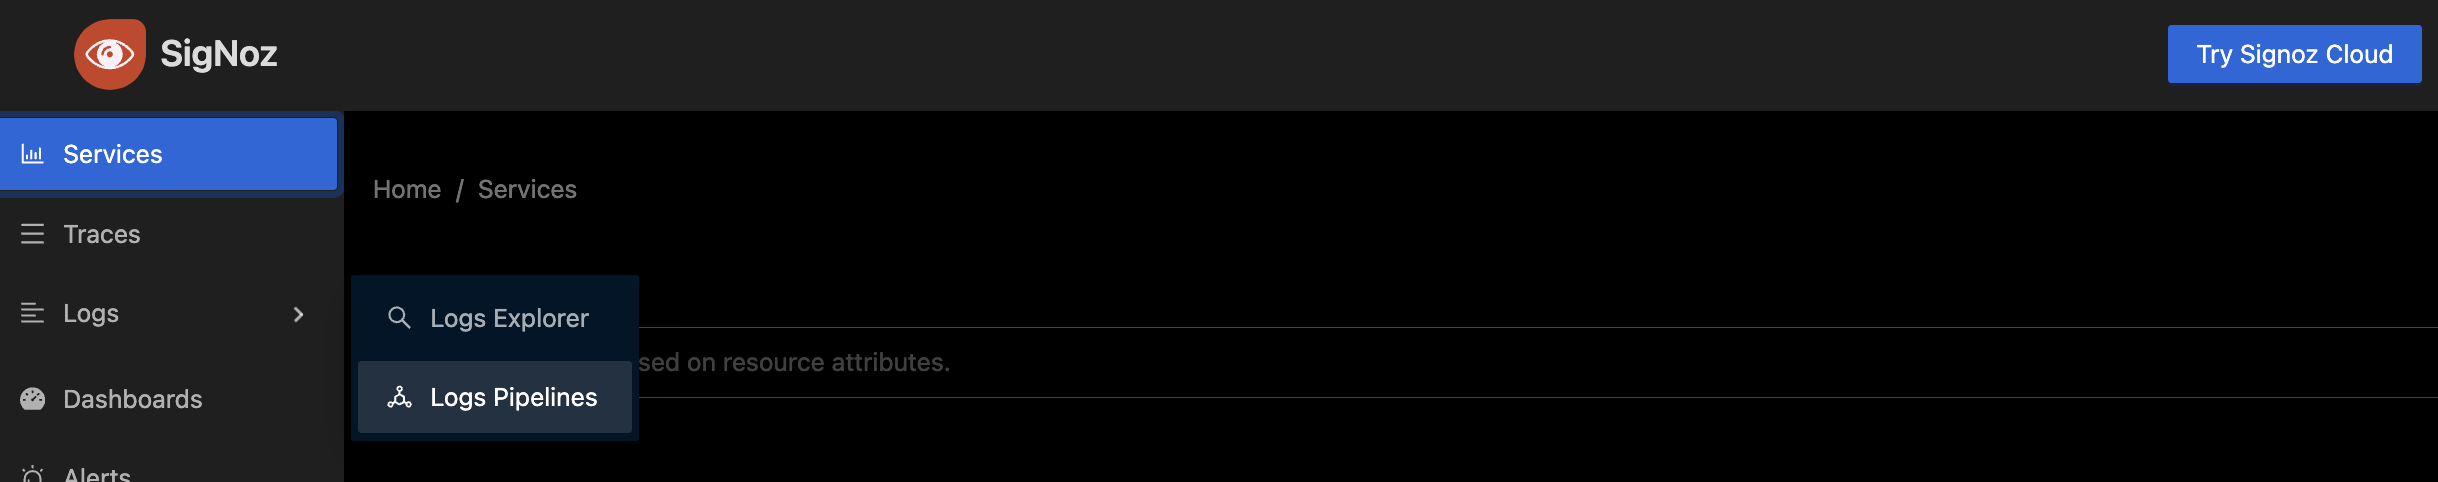
Sidebar navigation for getting to Logs Pipelines page
Step 2: Create a New Pipeline
Open the "Create New Pipeline" dialog.
- If you do not have existing pipelines, press the "New Pipeline" button.
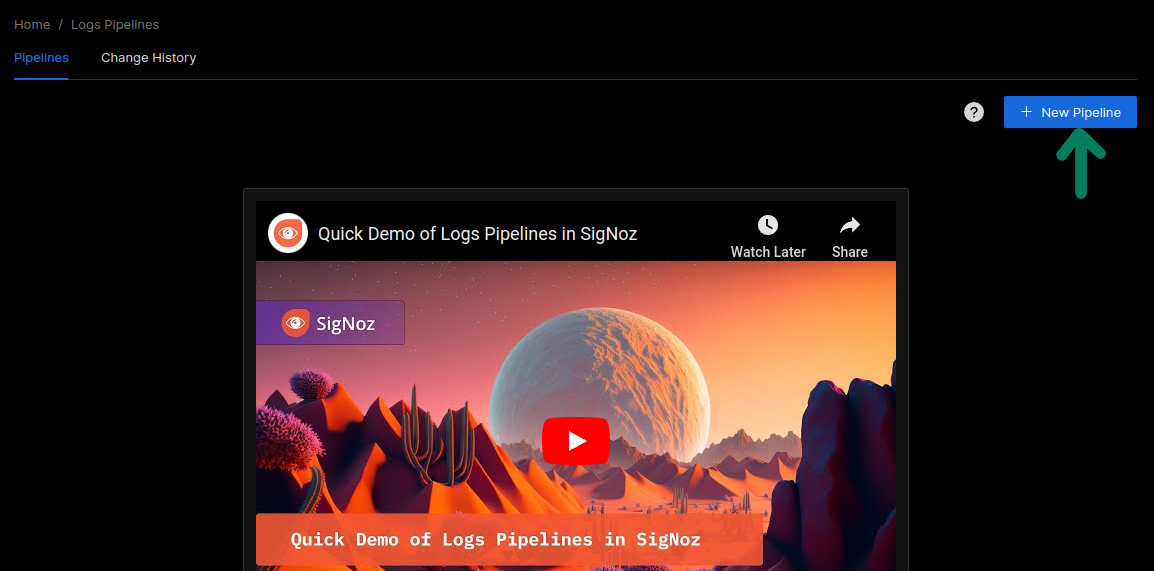
New Pipeline Button
- If you already have some pipelines, press the "Enter Edit Mode" button and then click the "Add a New Pipeline" button at the bottom of the list of pipelines.
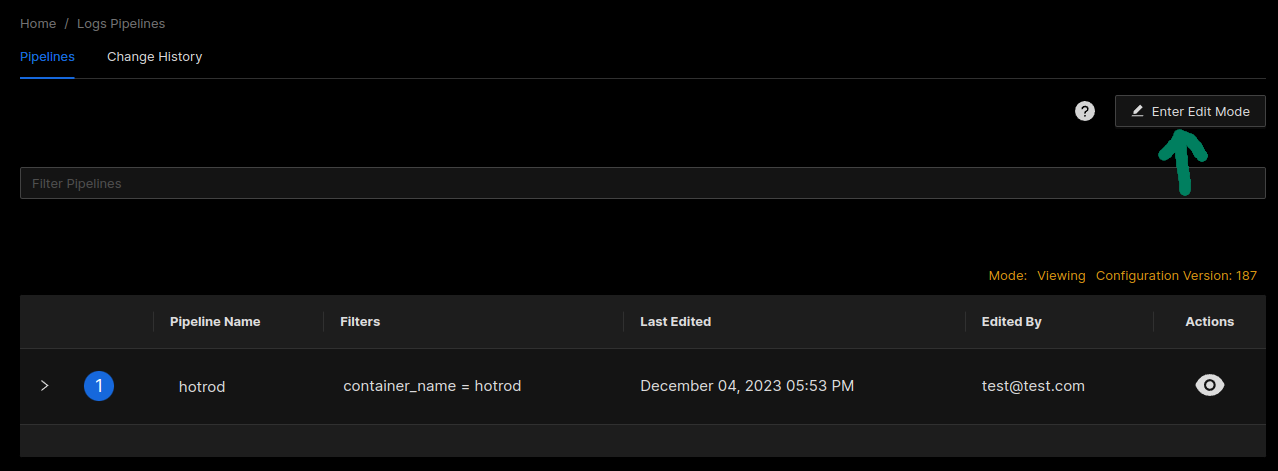
Enter Edit Mode button
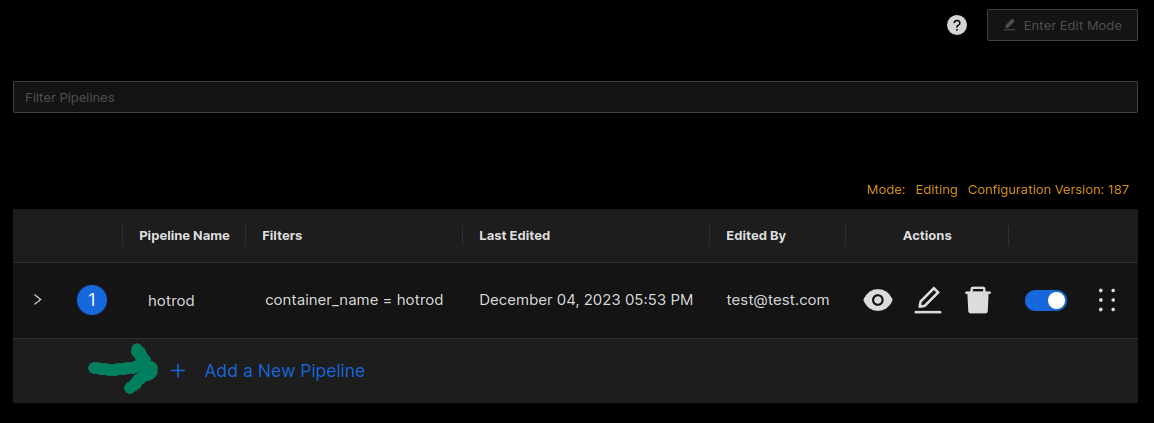
Add a New Pipeline button
Provide details about the pipeline in the Create Pipeline Dialog.
- Use the Name field to give your pipeline a descriptive short name.
- Use the Description field to add a detailed description for your pipeline.
- Use the Filter field to select the logs you want to process with this pipeline. Typically, these are filters identifying the source of the logs you want to process.
service = checkoutfor example. - Use the Filtered Logs Preview to verify that the logs you want to process will be selected by the pipeline.
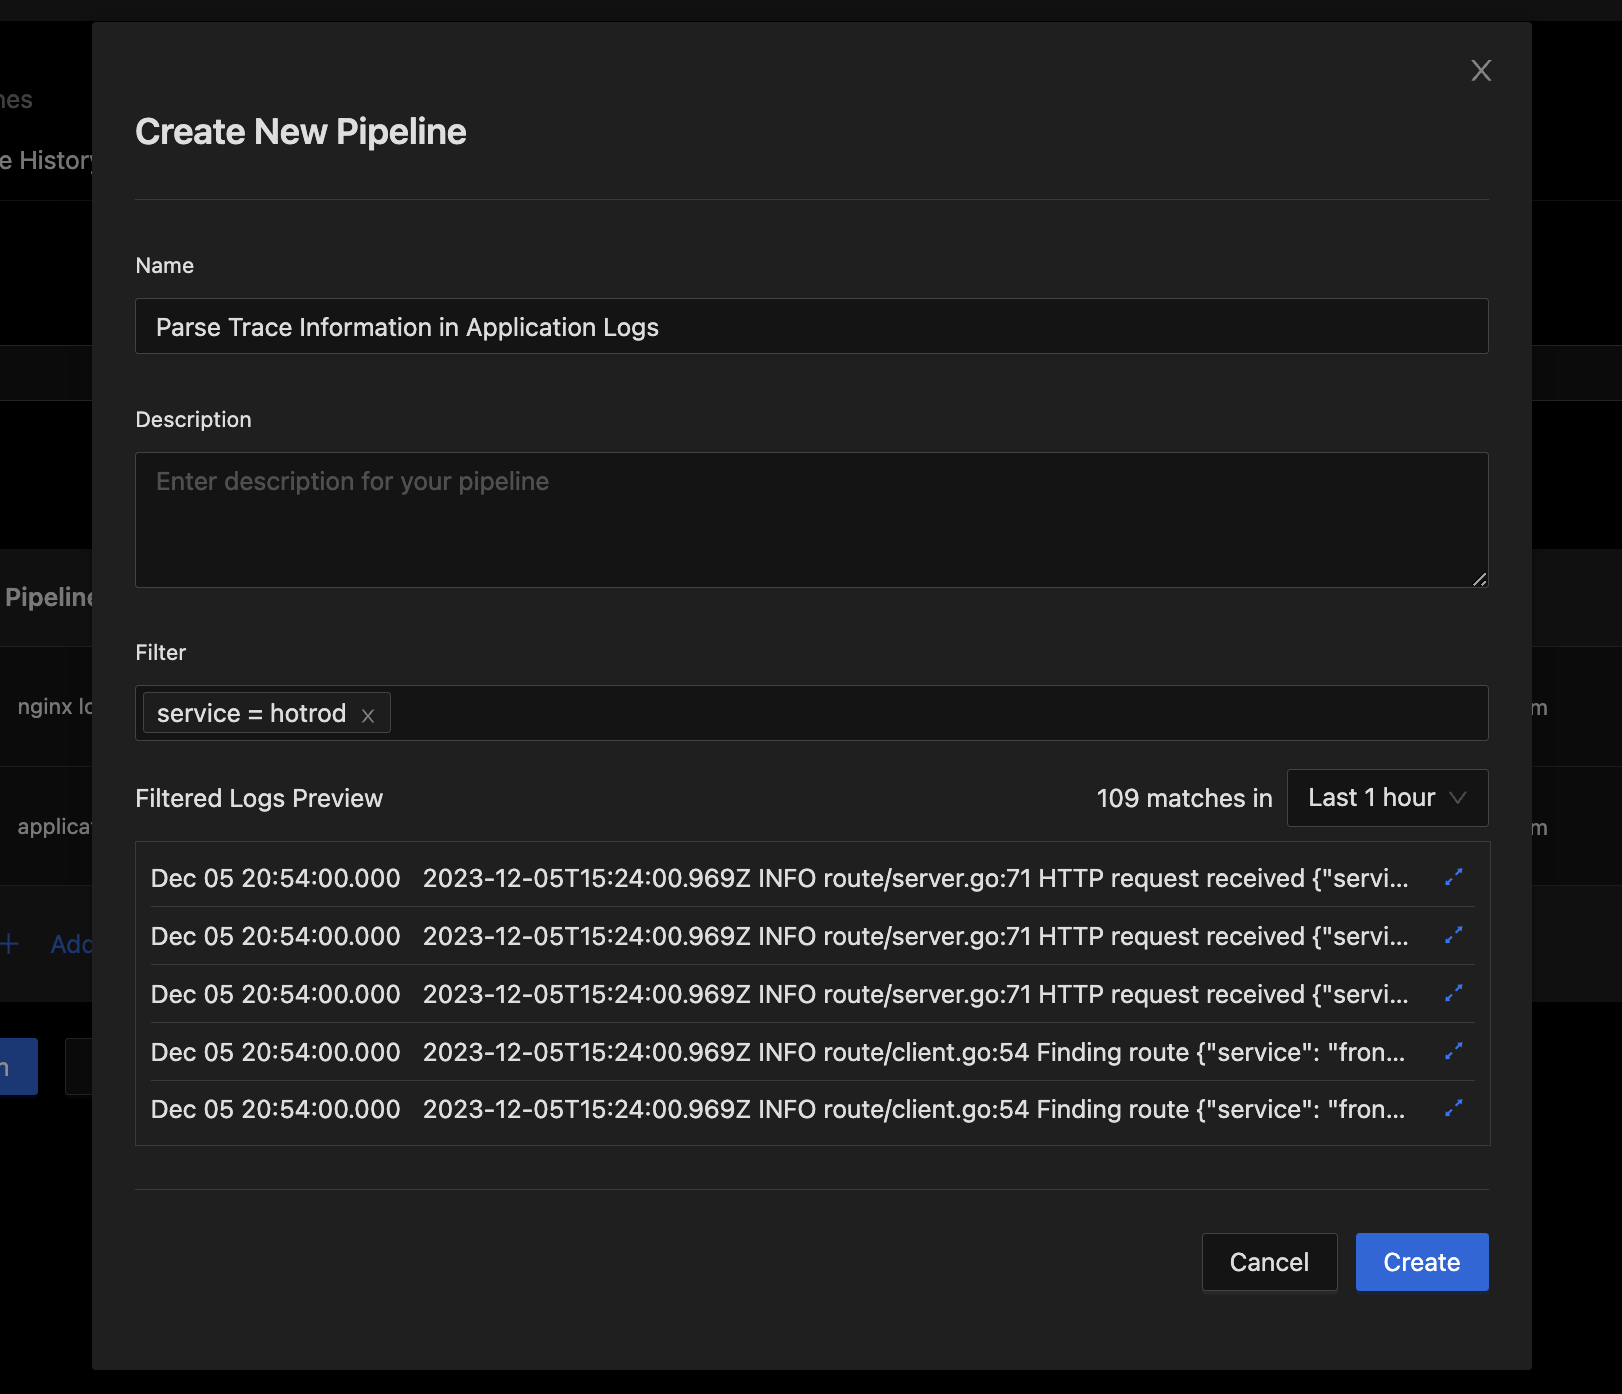
Create New Pipeline dialog
Press the "Create" button if everything looks right.
Step 3: Add Processors for Parsing Trace Information
- Expand the new Pipeline to add processors to it.
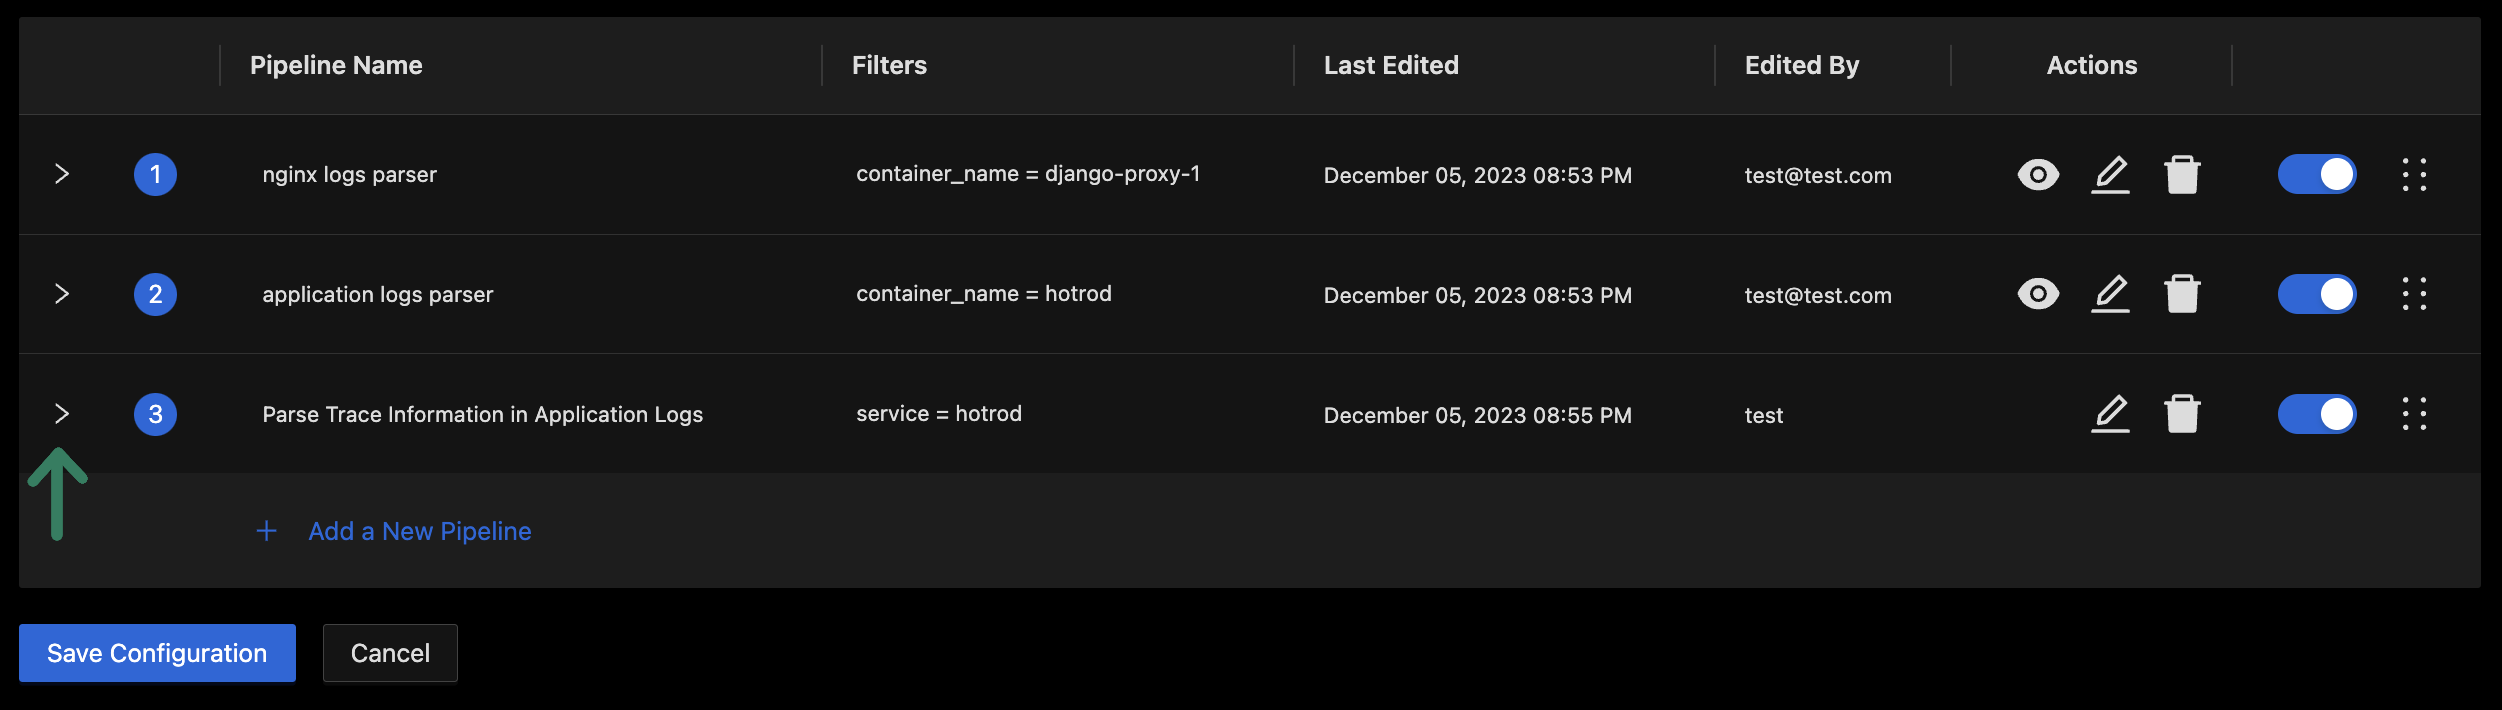
Creating a Pipeline adds it to the end of the Pipelines List. It can be expanded by clicking the highlighted icon.
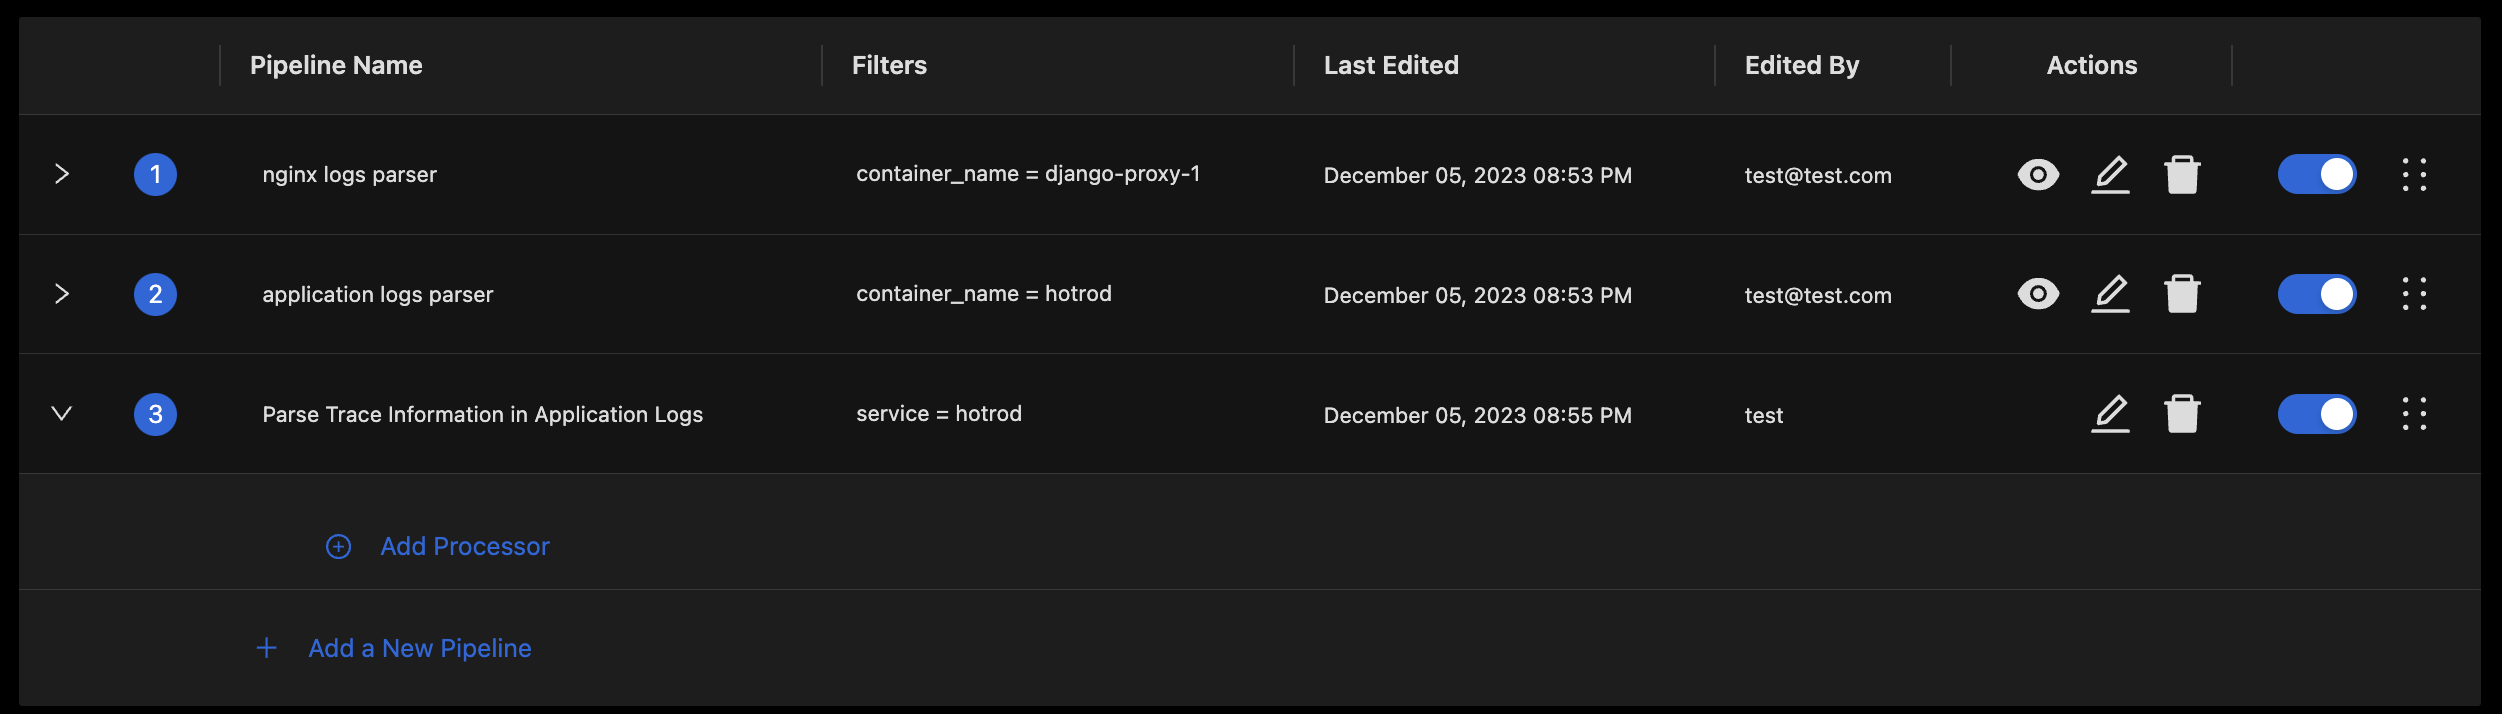
Expanding a pipeline shows the Add Processor button
Add a processor to parse trace information out of log attributes.
- Click the Add Processor Button to bring up the Dialog for adding a new processor.
- Select
Trace Parserin the Select Processor Type field. - Use the Name of Trace Parser Processor field to set a short descriptive name for the processor.
- Use the Parse Trace Id From field to specify the log attribute containing trace id.
- Use the Parse Span Id From field to specify the log attribute containing span id.
- Use the Parse Trace Flags From field to specify the log attribute containing trace flags.
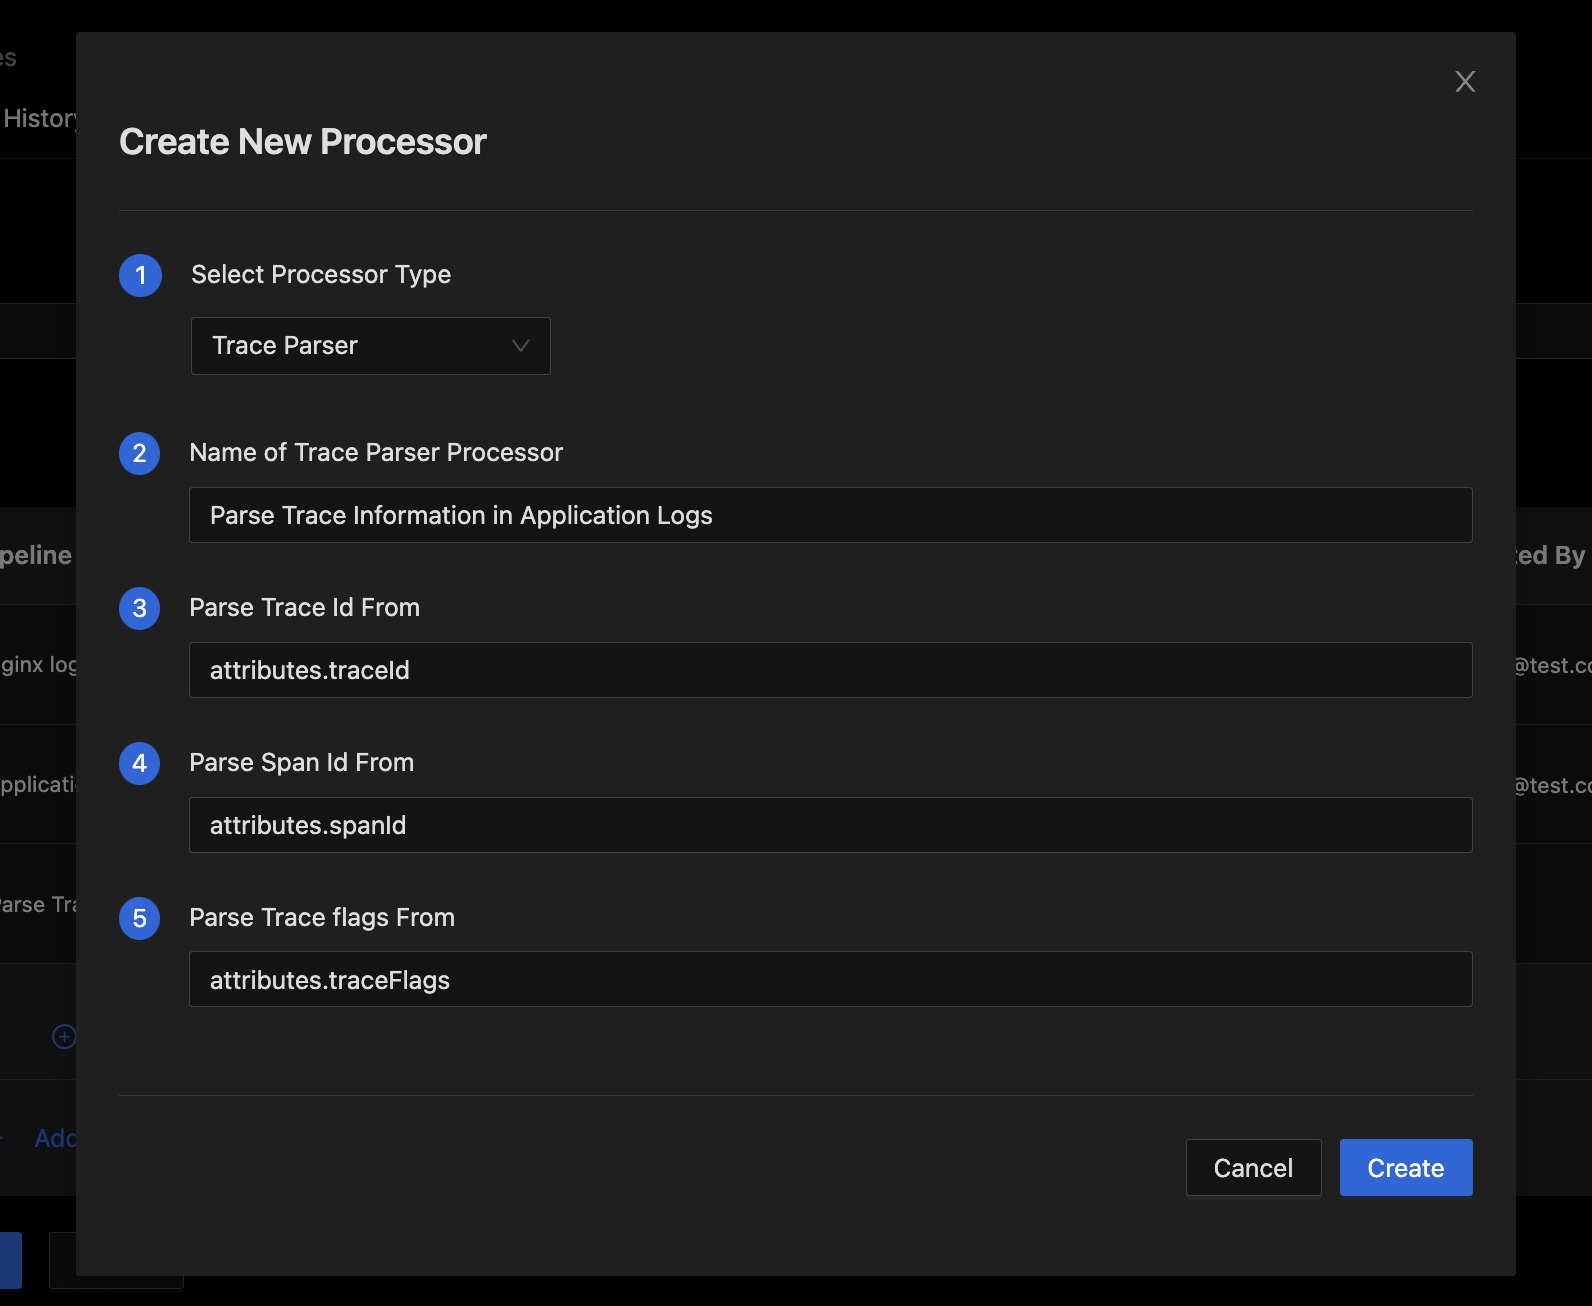
Add New Processor Dialog
📝 NoteAt least one of the Parse From fields (
Parse Trace Id From,Parse Span Id FromandParse Trace Flags From) must be specified.- Press the Create button to finish adding the processor.
Optional: Add processors for removing log attributes containing trace information
- Click the Add Processor Button to bring up the Dialog for adding a new processor.
- Select
Removein the Select Processor Type field. - Use the Name of Remove Processor field to set a short descriptive name for the processor.
- Set Field input to path of the attribute containing trace data.
attributes.traceIdfor example.
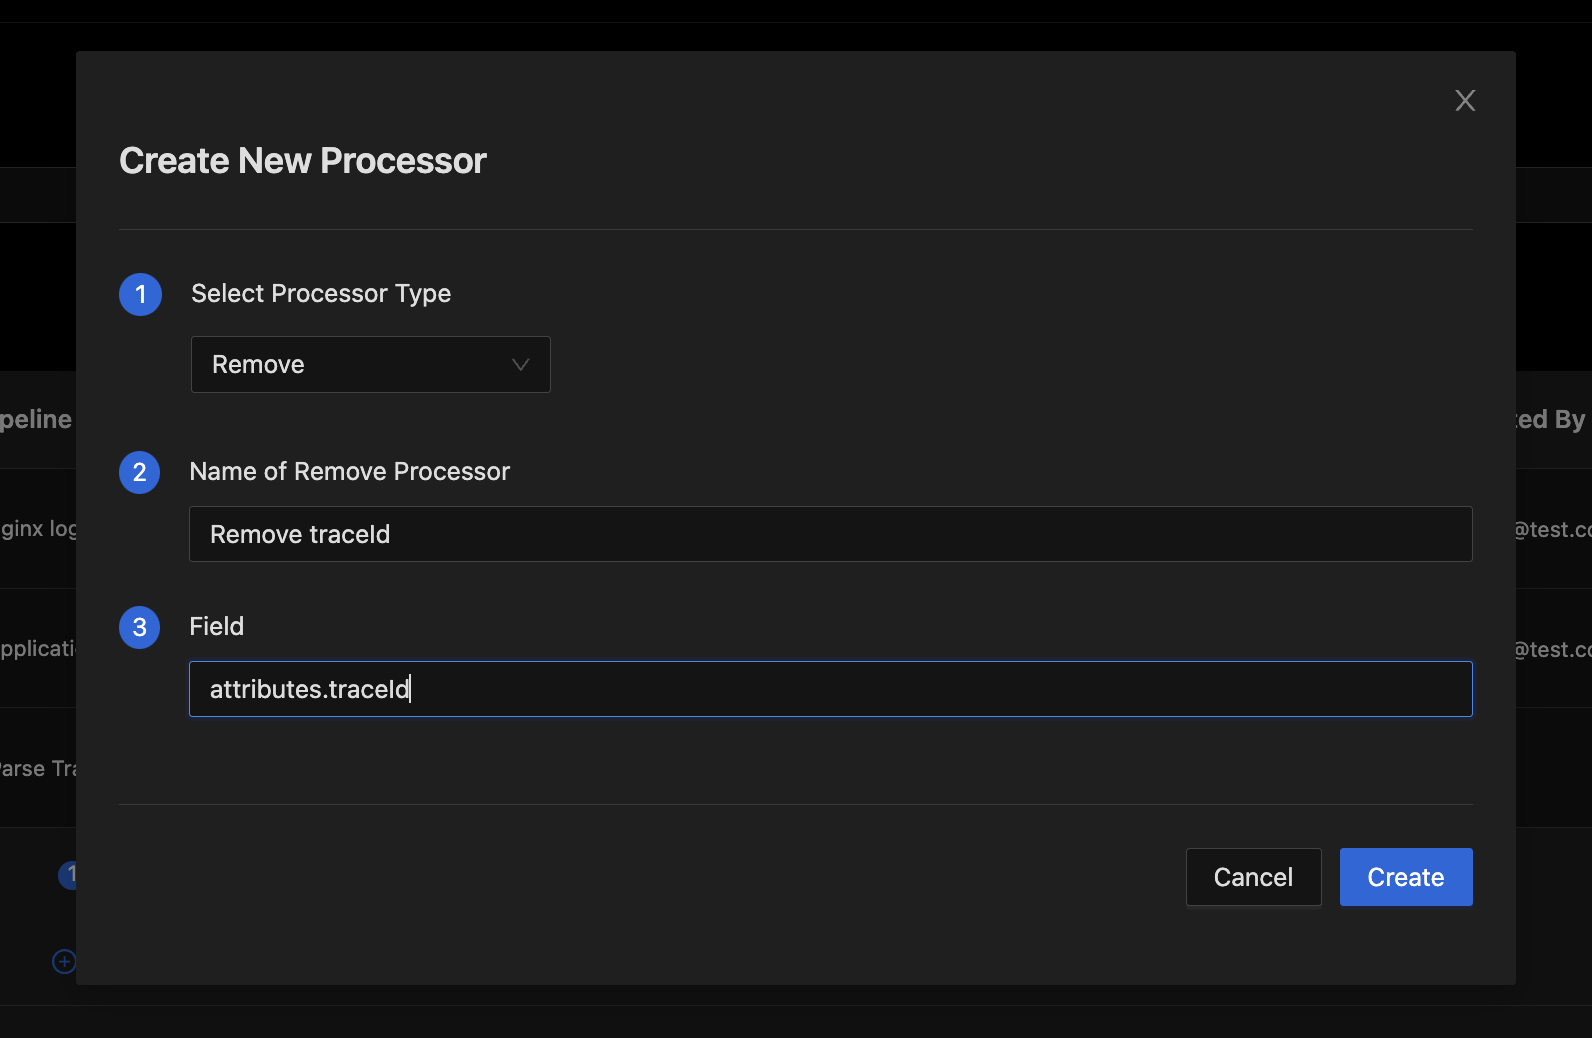
Remove Processor Dialog
- Press the Create button to finish adding the processor.
- Repeat these steps to create a Remove processor for removing each log attribute whose data has been parsed into trace fields.
Step 4: Preview and Validate Pipeline Processing
At this point you should have the pipeline ready with all necessary processors.
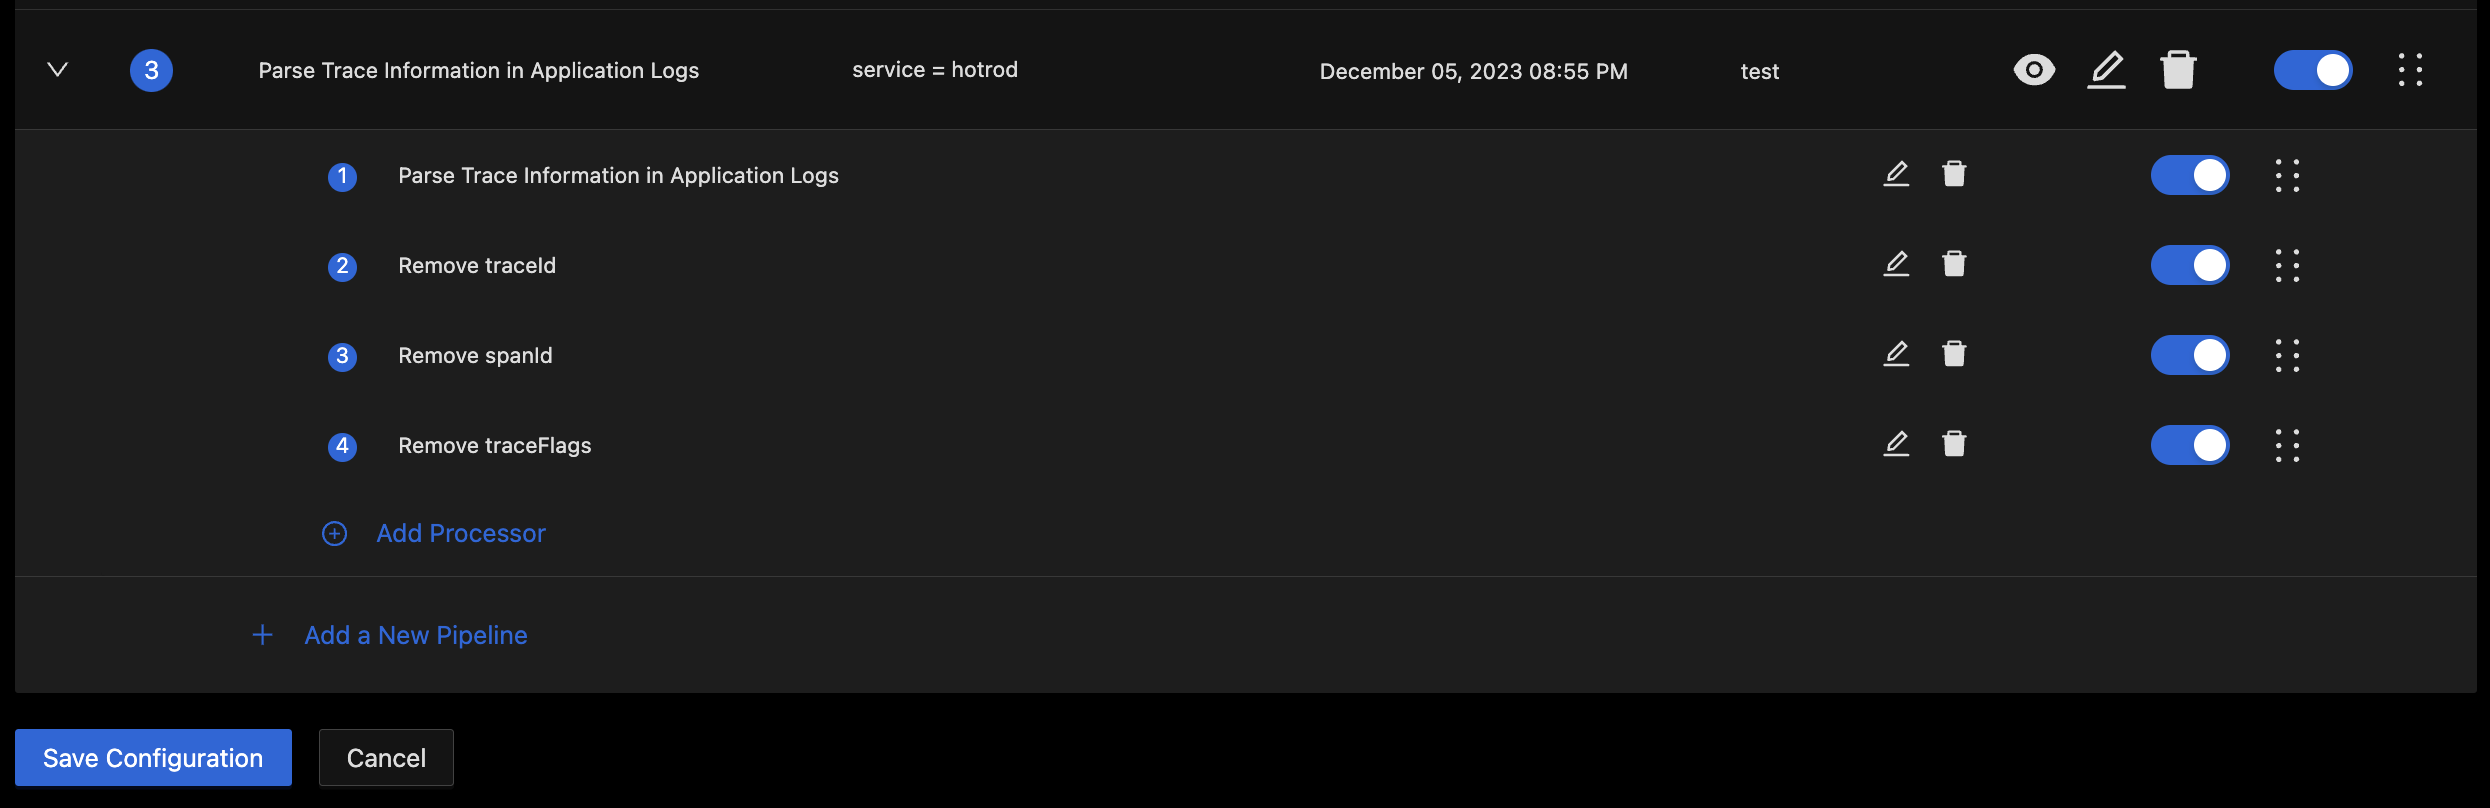
Expanded Pipeline with Processors for parsing trace information out of log attributes.
Before we save and deploy the pipeline, it is best to simulate processing on some sample logs to validate that the pipeline will work as expected.
Click the "eye" icon in the actions column for the pipeline to bring up the Pipeline Preview Dialog
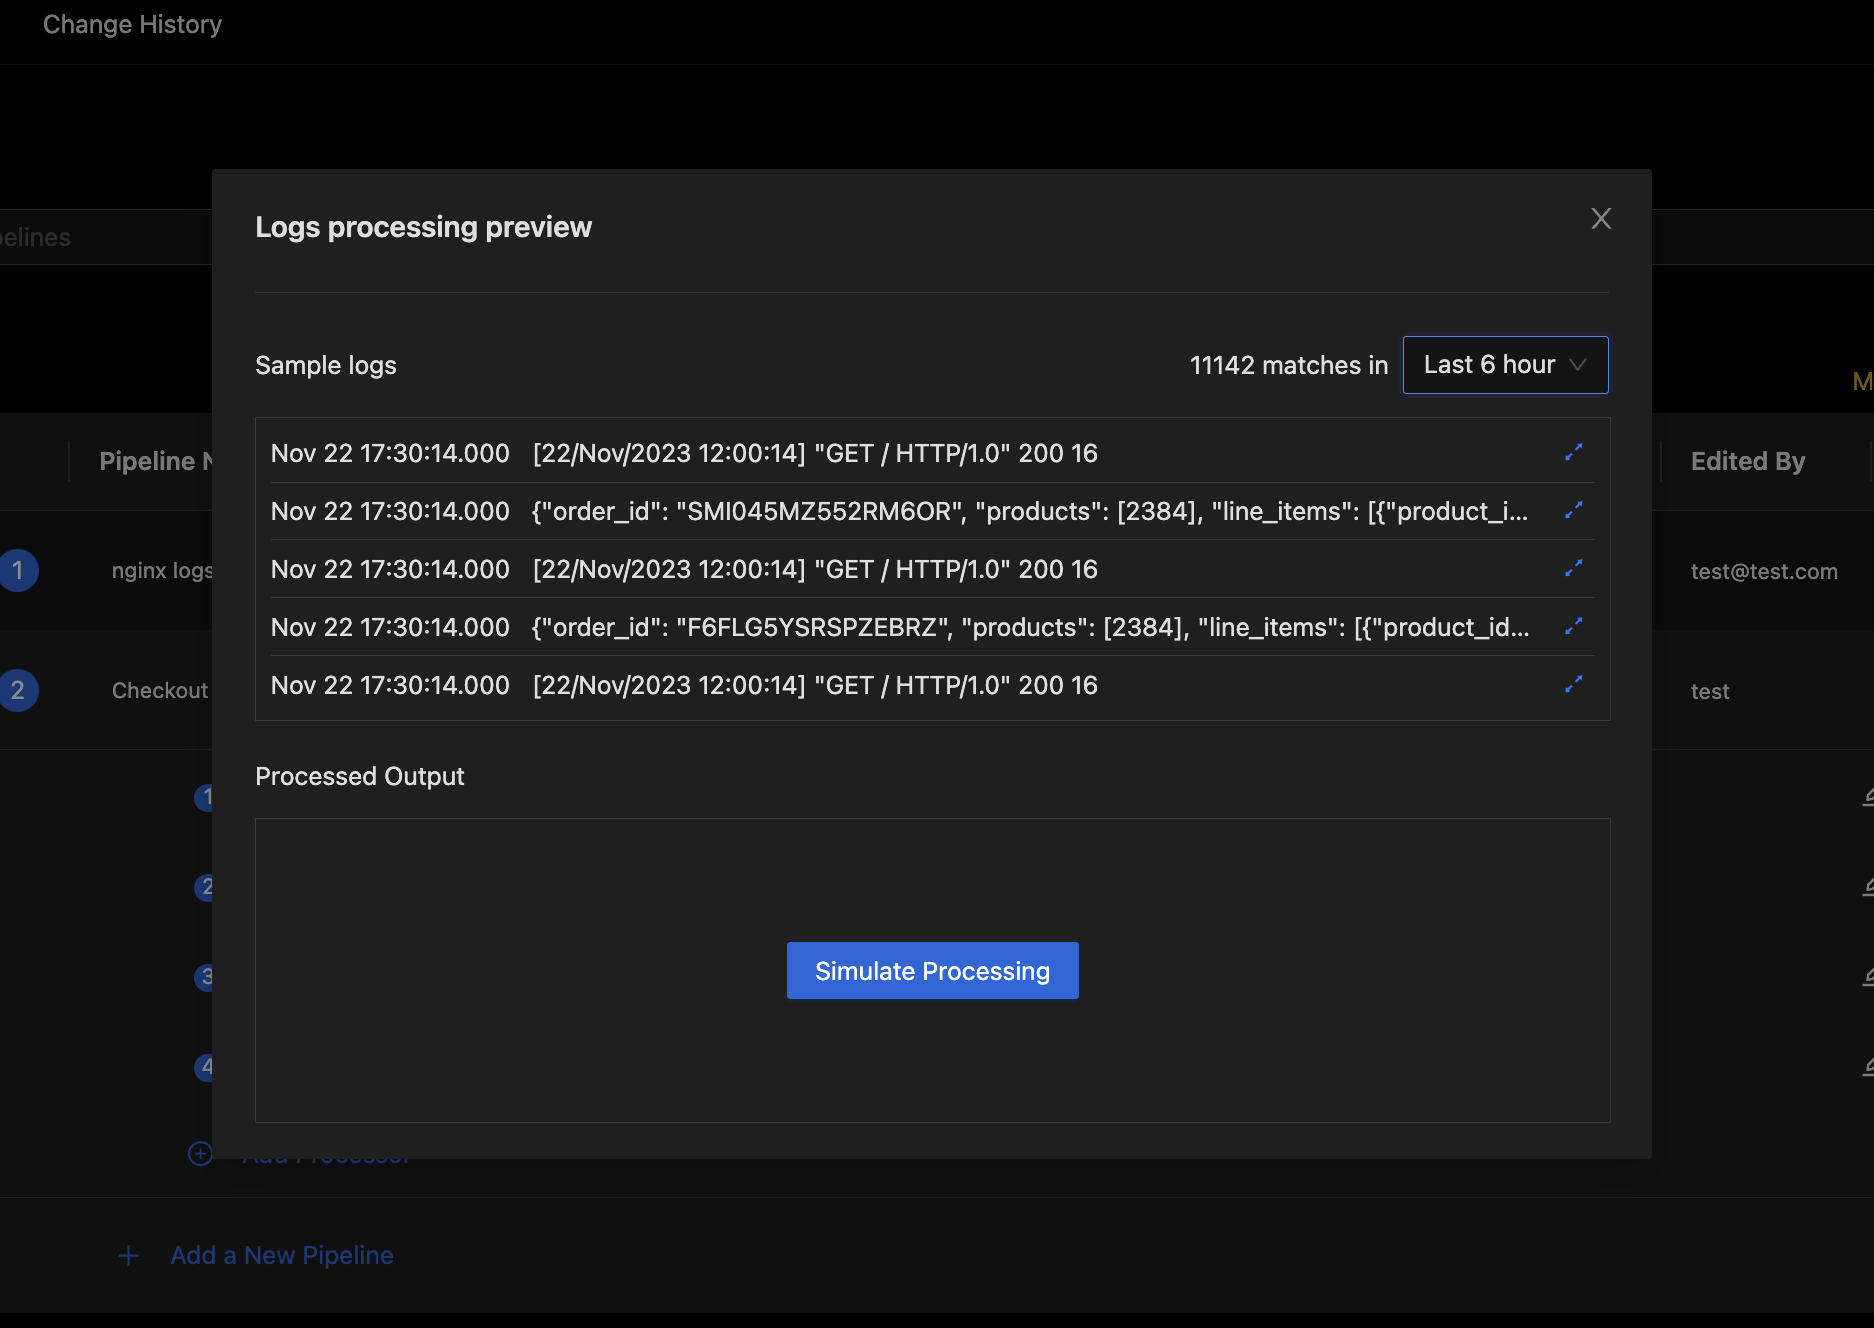
Pipeline Preview with Sample Logs
The preview Dialog will start out with sample logs queried from the database. You can adjust the sample logs search duration if there are no recent samples available.
To simulate pipeline processing, press the Simulate Processing button in the bottom section of the Pipeline Preview Dialog.
This will simulate pipeline processing on the sample logs and show the output.
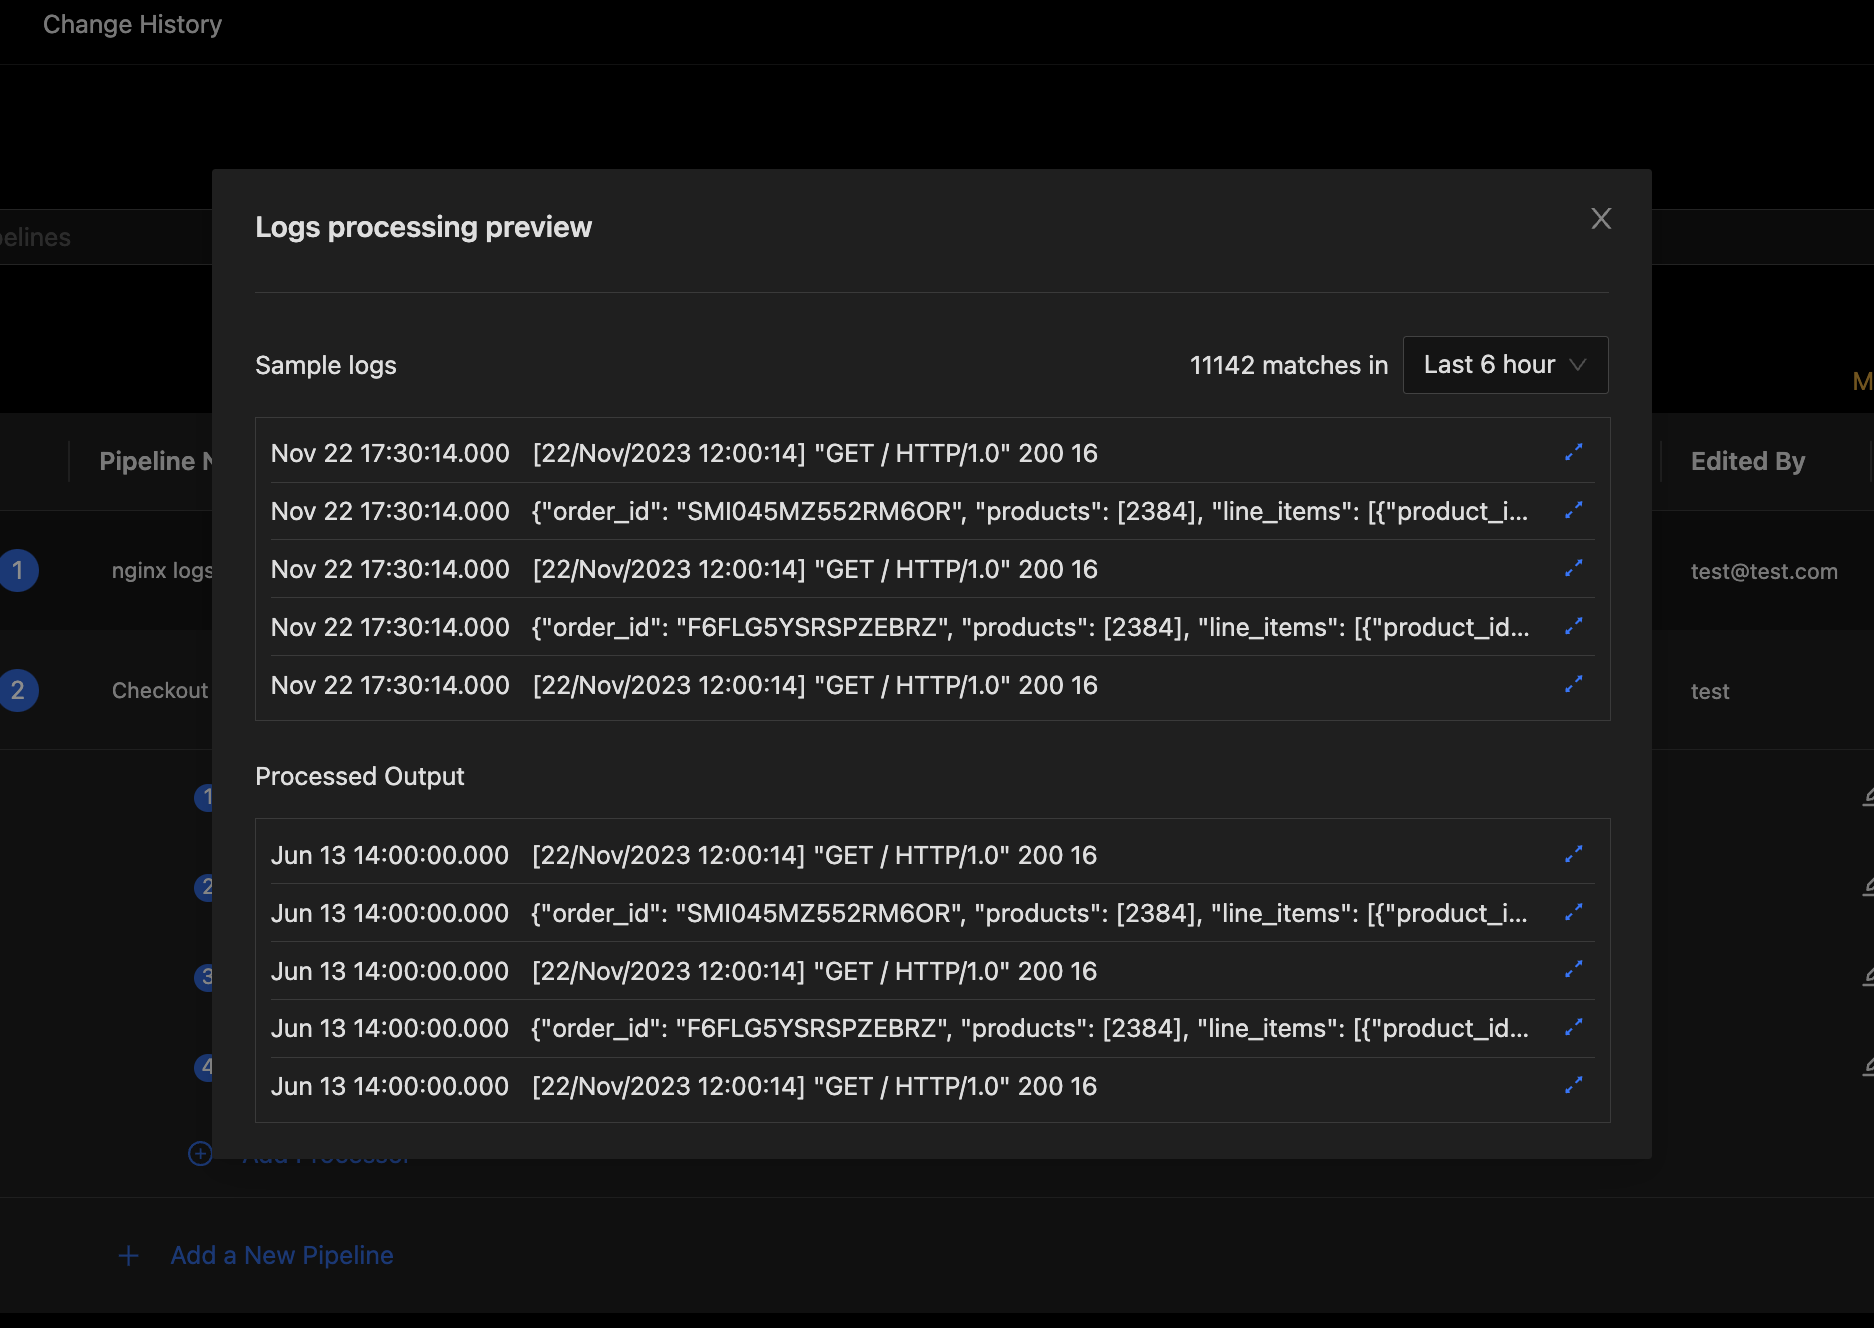
Pipeline Preview with Processed Output
You can click on the expand icon on the right end of each processed log to open the detailed view for that log. Expand some of the processed logs to verify that trace information was populated as expected.
If you see any issues, you can close the preview, edit your processors as needed and preview again to verify. Iterate on your pipeline and processor config until it all works just the way you want it.
Step 5: Save Pipelines and Verify
Once you have previewed your pipeline and verified that it will work as expected, press the Save Configuration button at the bottom of the pipelines list to save pipelines. This will store the latest state of your pipelines and will deploy them for pre-processing.
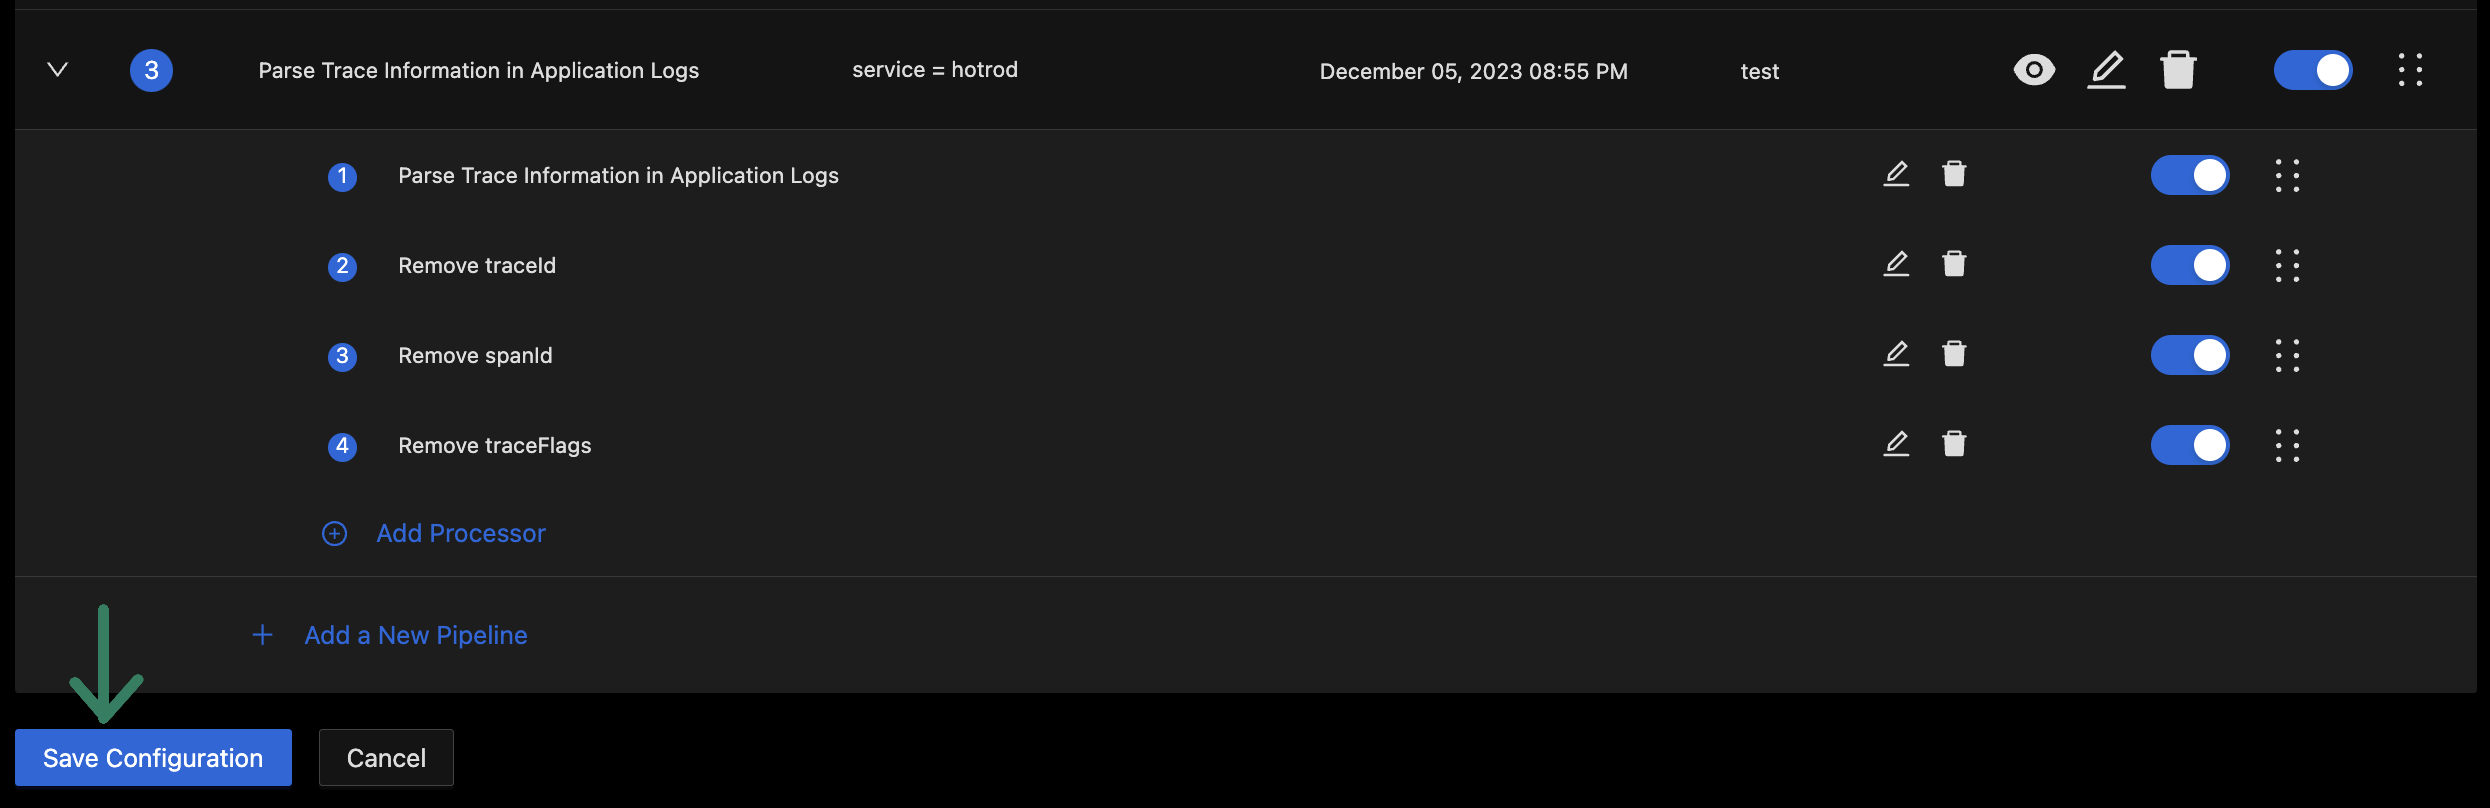
Save Configuration Button
You can track the deployment status of your pipelines using the Change History tab at the top of the pipelines page.
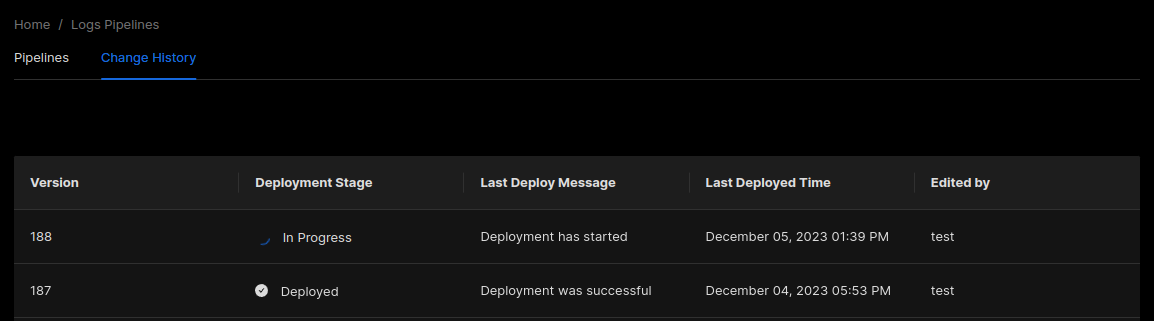
Pipelines Change History
Wait for a few minutes to let the pipelines deploy and for the latest batches of logs to get pre-processed and stored in the database. Then you can head over to the logs explorer to verify that trace fields (trace_id, span_id and trace_flags) are being populated in your logs as expected.
